CloudCheckr’s Amazon Web Services Survey Results – March 2013
6 min read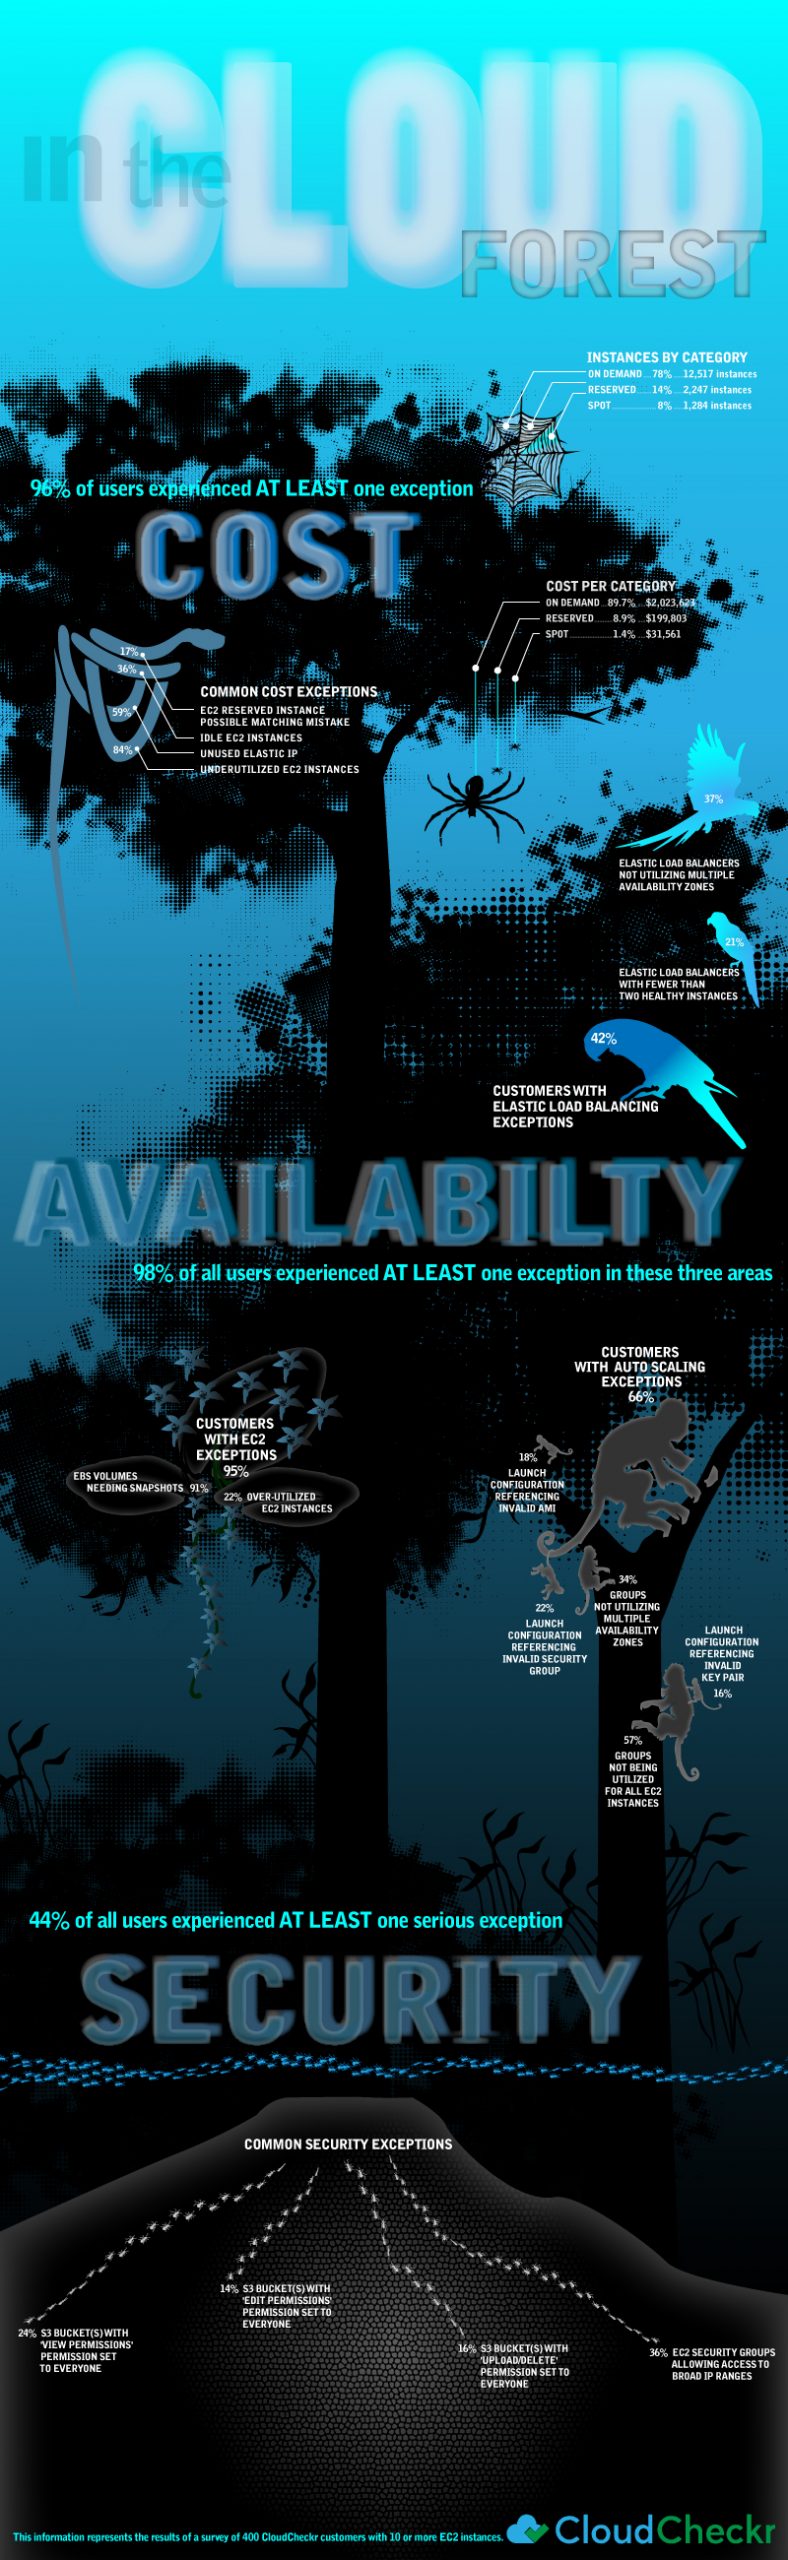
Amazon Cloud is all about going big on performance and less on price, atleast that’s what we know till now. However, i always wondered if there could be more done to the way AWS is used to increase savings. Recently, CloudCheckr conducted an extensive research to check on how properly customers of AWS were able to use it. The results were extremely surprising, though not for CloudCheckr. We Would like to release the Amazon Web Services Survey results to the general public on behalf of CloudCheckr. You can also find an interesting infographic that analyzes the AWS performance, price and error issues.
CloudCheckr:
We were heartened when AWS made Trusted Advisor free for the month of March. This was an implicit acknowledgement of what many have long known: AWS is extremely complex and it is challenging for users to provision and control their AWS infrastructure properly.
We took the AWS announcement as an opportunity to conduct an internal survey of our customers’ usage. We compared the initial assessments of 400 of our users’ accounts against our 125+ best practice checks for proper configurations and policies. Our best practice checks span 3 key categories: Cost, Availability, and Security. We limited our survey to users with 10 or more running EC2 instances. In aggregate, the users were running more than 16,000 EC2 instances.

We were surprised to discover that nearly every customer (99%) experienced at least one serious exception. Beyond this top level takeaway, our primary conclusion was that controlling cost may grab the headlines, but users also need to button up a large number of availability and security issues.
When considering availability, there were serious configuration issues that were common across a high percentage of users. Users repeatedly failed to optimally configure Auto Scaling and ELB. The failure to create sufficient EBS snapshots was an almost universal issue.
Although users passed more of our security checks, the exceptions which did arise were serious. Many of the most commons security issues were found in configurations for S3, where nearly 1 in 5 users allowed unfettered access to their buckets through “Upload /Delete” or “Edit Permissions” set to everyone. As we explained in an earlier whitepaper, anyone using a simple bucket finder tool could locate and access these buckets.
Beyond the numbers, we also interviewed customers to gather qualitative feedback from users on some of the more interesting data points.
Conclusions by Area
Conclusions based upon Cost Exceptions:
As noted, our sample was comprised of 16,047 instances. The sample group spent a total of $2,254,987 per month on EC2 (and its associated costs) for average monthly cost per customer of $7516. Of course, we noted the mismatch between quantity and cost – spot instances represent 8% of the quantity but only 1.4% of the cost. This is due to the significantly less expensive price of spot instances compared to on demand.
When we looked at the Cost Exceptions, we found that 96% of all users experienced at least 1 exception (with many experiencing multiple exceptions). In total, we found that users who adopted our recommended instance sizing and purchasing type were able to save an average of $3974 per month for an aggregate total of $1,192,212 per month.
This suggested that price optimization remains a large hurdle for AWS users who rely on native AWS tools. Users consistently fail to optimize purchasing and also fail to optimize utilization. These combined issues meant that the average customer paysnearly twice as much as necessary for resources to achieve proper performance for their technology.
To further examine this behavior, we interviewed a number of customers. We interviewed customers who exclusively purchased on-demand and customers who used multiple purchasing types.
Here were their answers (summarized and consolidated):
- Spot instances worry users – there is a general concern of: “what if the price spikes and my instance is terminated?” This fear exists despite the fact that spikes occur very rarely, warnings are available, and proper configuration can significantly mitigate this “surprise termination” risk.
- It is difficult and time consuming to map the cost scenarios for purchasing reserved instances. The customers who did make this transition had cobbled together home grown spreadsheets as a way of supporting this business decision. The ones who didn’t make this effort made a gut estimate that it wasn’t worth the time. AWS was cost effective enough and the time and effort for modeling the transition was an opportunity cost taken away from building and managing their technology.
- The intricacies of matching the configurations between on demand instances and reserved instances while taking into consideration autoscaling and other necessary configurations were daunting. Many felt it was not worth the effort.
- Amazon’s own process for regularly lowering prices is a deterrent to purchasing RIs. This is especially true for RIs with a 3 year commitment. In fact, within the customers who did purchase RI, none expressed a desire to purchase RIs with a 3 year commitment. All supported their decision by referencing the regular AWS price drops combined with the fact that they could not accurately predict their business requirements 3 years out.
Conclusions based upon Availability Exceptions:
We compared our users against our Availability best practices and found that nearly 98% suffered from at least 1 exception. We hypothesized that this was due to the overall complexity of AWS and interviewed some of our users for confirmation. Here is what we found from those interviews:
- Users were generally surprised with the exceptions. They believed that they “had done everything right” but then realized that they underestimated the complexity of AWS.
- Users were often unsure of exactly why something needed to be remedied. The underlying architecture of AWS continues to evolve and users have a difficult time keeping up to speed with new services and enhancements.
- AWS dynamism played a large role in the number of exceptions. Users commented that they often fixed exceptions and, after a week of usage, found new exceptions had arisen.
- Users remained very happy with the overall level of service from AWS. Despite the exceptions which could diminish overall availability, the users still found that AWS offered tremendous functionality advantages.
Conclusion bases upon Security Exceptions:
Finally, we looked at security. Here we found that 44% of our users had at least one serious exception present during the initial scan. The most serious and common exceptions occurred within S3 usage and bucket permissioning. Given the differences in cloud v. data center architecture, this was not entirely surprising. We interviewed our users about this area and here is what we found:
- The AWS management console offered little functionality for helping with S3 security. It does not provide a use friendly means of monitoring and controlling S3 inventory and usage. In fact, we found that most of our users were surprised when the inventory was reported. They often had 300-500% more buckets, objects and storage than they expected.
- Price = Importance, S3 is often an afterthought for users. Because it is so inexpensive users do not audit it as closely as EC2 and other more expensive services and rarely create and implement formal policies for S3 usage. The time and effort required to log into each region one by one to collect S3 information and download data through the Management console was not worth the effort relative to spend.
- Given the low cost and lack of formal policies, team members throw up high volumes of objects and buckets knowing that they can store huge amounts of data at a minimal cost. Since users did notauditwhat they had stored, they could not determine the level of security.
Underlying Data Summary
Cost: Any exception 96%
The total of 16,047 instances was broken in the following categories:
- On Demand: 78% (12,517 instances)
- Reserved: 14% (2,247 instances)
- Spot: 8% (1,284 instances)
The instance purchasing was broken down as follows:
- On Demand: 89.7% ($2,023,623)
- Reserved: 8.9% ($199,803)
- Spot: 1.4% ($31,561)
Common Cost Exceptions we found:
- Idle EC2 Instances 36%
- Underutilized EC2 Instances 84%
- EC2 Reserved Instance Possible Matching Mistake 17%
- Unused Elastic IP 59%
Availability: Any exception 98%
Here, broken out by service, are some highlights of common and serious exceptions that we found:
Service Type: Customers with Exceptions
EC2: Any exception 95%
- EBS Volumes That Need Snapshots 91%
- Over Utilized EC2 Instances 22%
Auto Scaling: Any exception 66%
- Auto Scaling Groups Not Being Utilized For All EC2 Instances 57%
- All Auto Scaling Groups Not Utilizing Multiple Availability Zones 34%
- Auto Scaling Launch Configuration Referencing Invalid Security Group 22%
- Auto Scaling Launch Configuration Referencing Invalid AMI 18%
- Auto Scaling Launch Configuration Referencing Invalid Key Pair 16%
ELB: Any exception 42%
- Elastic Load Balancers Not Utilizing Multiple Availability Zones 37%
- Elastic Load Balancers With Fewer Than Two Healthy Instances 21%
Security: Any exception 46%
These were the most common exceptions that we found:
- EC2 Security Groups Allowing Access To Broad IP Ranges 36%
- S3 Bucket(s) With ‘Upload/Delete’ Permission Set To Everyone 16%
- S3 Bucket(s) With ‘View Permissions’ Permission Set To Everyone 24%
- S3 Bucket(s) With ‘Edit Permissions’ Permission Set To Everyone 14%


Hi Everyone, I’m Aaron Klein a co-founder of CloudCheckr. I hope you found the results of our survey interesting and informative. If you are curious to see how well your AWS account is configured, we’d like to invite you to set up a free account on CloudCheckr. You just need to enter read only credentials from your AWS account into CloudCheckr, and within a few minutes, you can see how well you scored against our best practice checks: free set up link here http://bit.ly/ZoGKYN